Opt-in rates are important.
They show how many people saw your offer (lead magnet) and thought it looked “juicy” enough to give you their email address.
The higher the opt-in rate, the more visitors you'll turn into subscribers and the faster you'll grow your email list.
- Related Course: How To Optimize Your Sales Funnel
Why Google Analytics?
9 times out of 10, your opt-in form software tracks conversions already.
It will tell you how many people saw your opt-in form and how many filled it out.
This is semi-helpful, but it doesn't share the whole story.
It doesn't show you where the person came from and how they ended up at your opt-in form.
This is where Google Analytics comes into play – it shows you the exact steps someone went through before giving you their email address.
Example
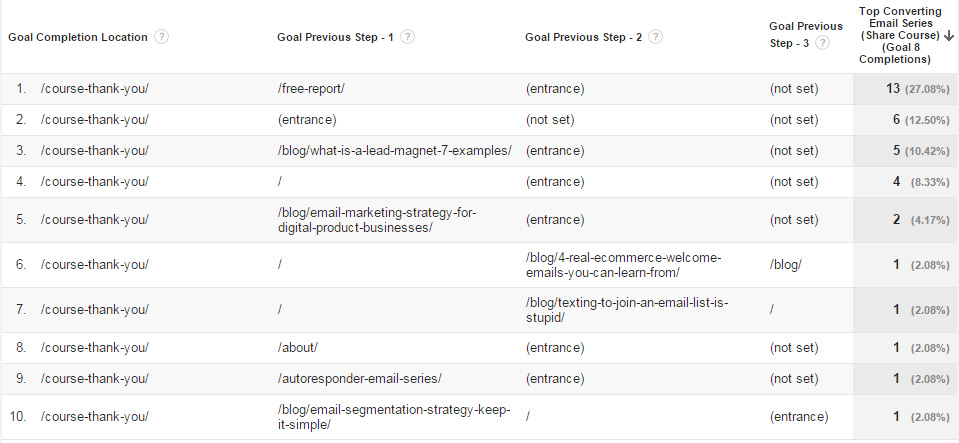
This is just an example of one report. There are several “standard” reports and you can customize your own to get the data you need.
Other Coolness
Google Analytics also helps you track how well your advertising campaigns are doing.
Of course, Google Adwords and Google Analytics go hand-in-hand; however, you can also add UTM Tags to any link in order to see how well it performs.
UTM Tags are beyond the scope of this post; however, if you'd like to read more – here's a great article.
The Whole Story [DISCLAIMER]
I want to clarify something really quickly about opt-in rates.
They are not the “end-all-be-all.”
What really matters is: How Many People Buy.
Let's pretend that you created an opt-in form and got it to a 90% conversion rate – wow! You achieved the impossible!
The problem is, the people subscribing end up not purchasing anything you sell because they don't purchase products online.
It doesn't matter how many people are on your email list, if they don't buy anything.
I'd much rather have a list of 100 people that buy my products than 10,000 people who just want free stuff.
Keep in mind – opt-in rates are an important metric to examine and optimize for; however, the quality of people you're bringing in matters most.
How To Track Your Email Opt-In Rates With Google Analytics
Step 1: Thank You Page
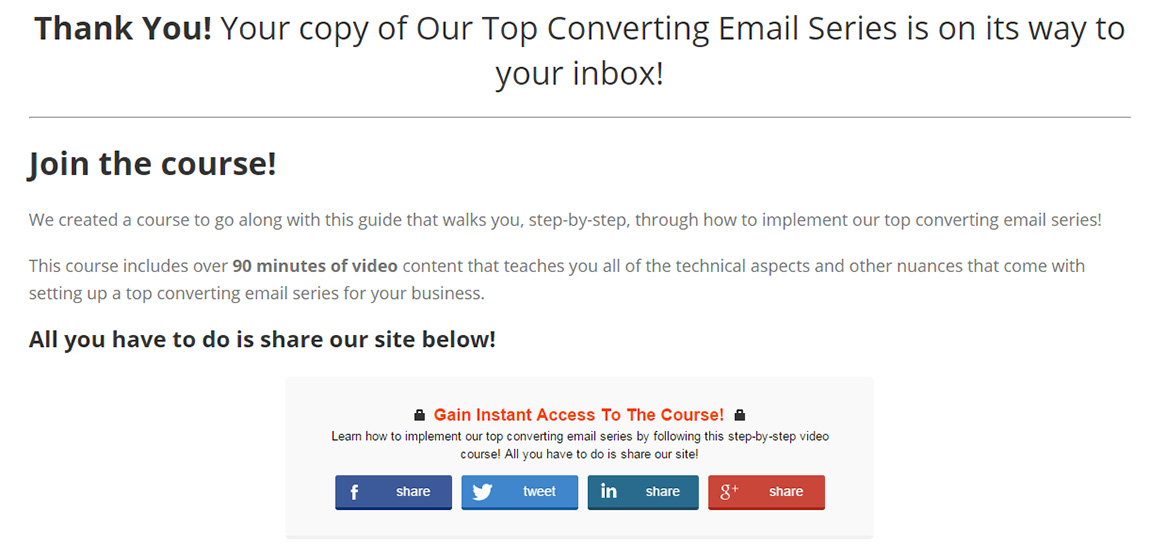
The first thing you will need is a Thank You Page (sometimes called a Confirmation Page).
It's the page someone arrives on after they give you their email address that “thanks” them for joining your email list or asks them to “confirm” their email address by checking their email and clicking a confirmation link.
For example – here's one of my Thank You pages:
Step 2: Connect Thank You Page To Opt-In Form
Depending on your opt-in form software – how to “connect” your thank you page is going to vary, so you may need to do a little bit of research … or, if you get really stuck, ask me.
Here are a few tutorials:
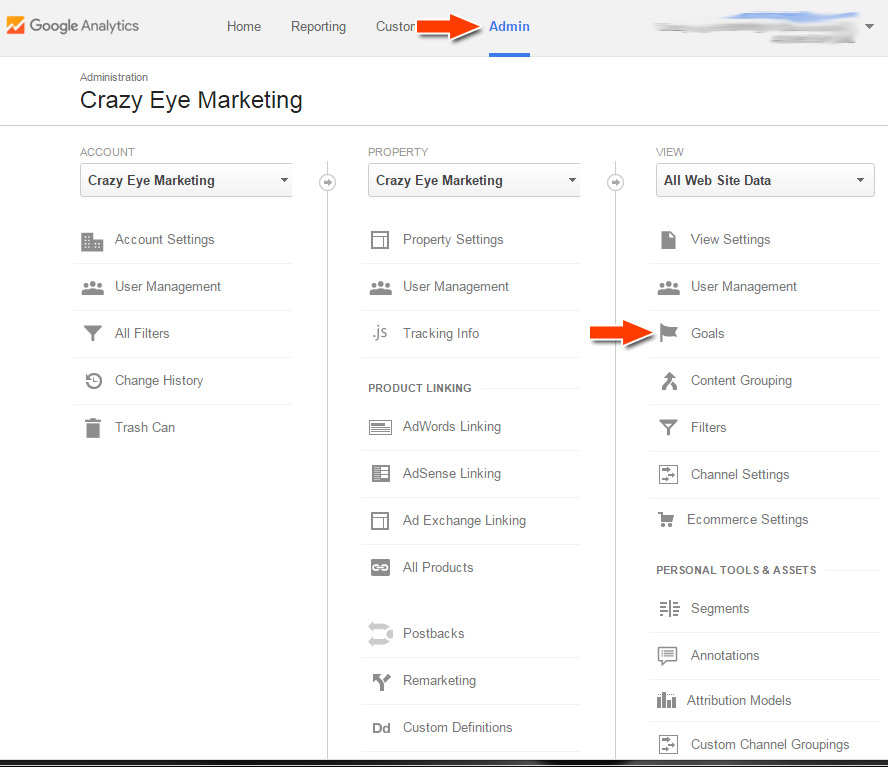
Step 3: Create Google Analytics Goal
Login to Google Analytics, navigate to the “Admin” tab and select “Goals”
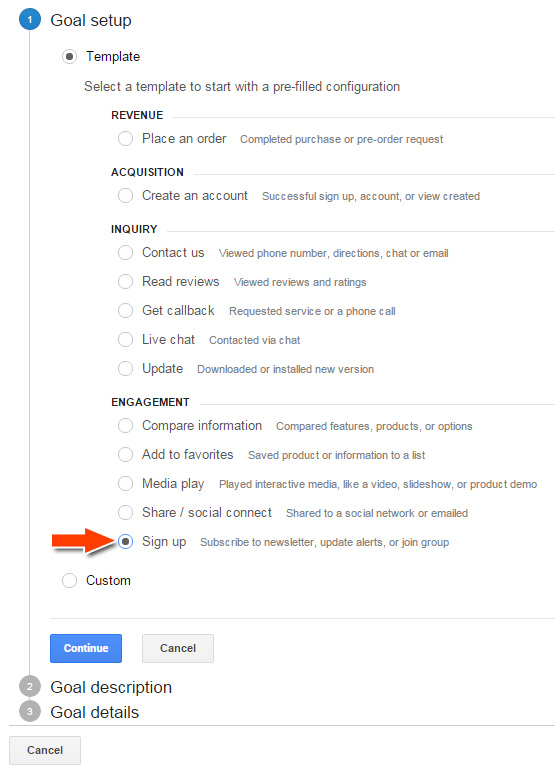
Step 4: Create a New Goal
Click the “New Goal” button:
![]()
Under “Engagement” select “Sign up” and then press “Continue”:
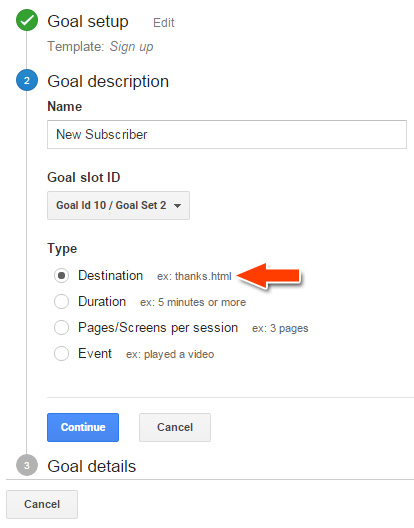
Name your goal (ie: New Subscriber), leave “Goal slot ID” alone, unless you know what you're doing with it … in which case, you wouldn't be viewing this tutorial … select “Destination” as “Type” and click “Continue”:
Select “Begins with” and enter the url path to your Thank You Page without including your domain (ie. /thank-you). Assigning a Value or a Funnel is not necessary at this point, unless you really want to; however, I recommend leaving them “Off” for the time being, you can change it later.
Then select “Verify Goal”:
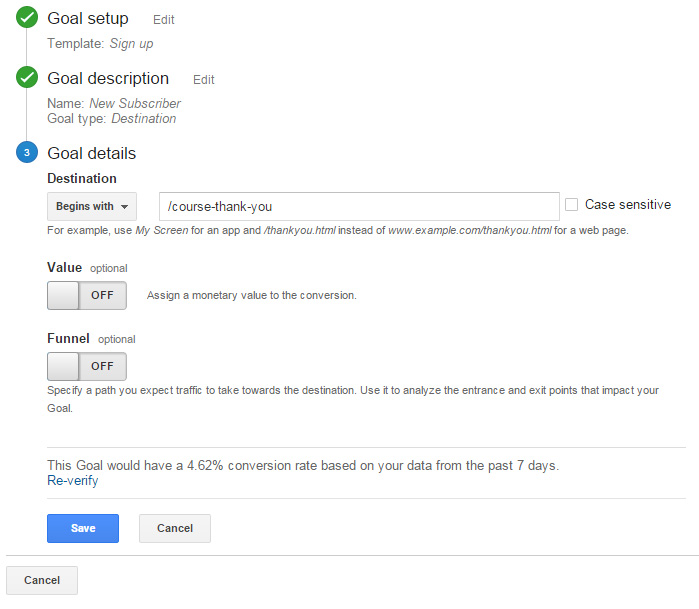
Ideally, you'll have had some traffic to your Thank You Page so you will see a conversion rate and verify that your Goal is setup properly.
If you haven't had any traffic to your Thank You Page – go visit it now and visit it on your phone too … just to get a couple “unique” visits. You'll have to wait a day or so for those visits to “count” … so, be sure to re-verify your goal in a day or two to make sure it's functioning properly.
Click “Save”
Step 5: Track
Now that you're tracking your conversions, it's time to view a few reports!
Select the “Reporting” tab at the top, then on the left select “Conversions”, “Goals”, and “Overview”.
Make sure you have the correct “Goal” selected, view the “Source / Medium” … and checkout what's happening!
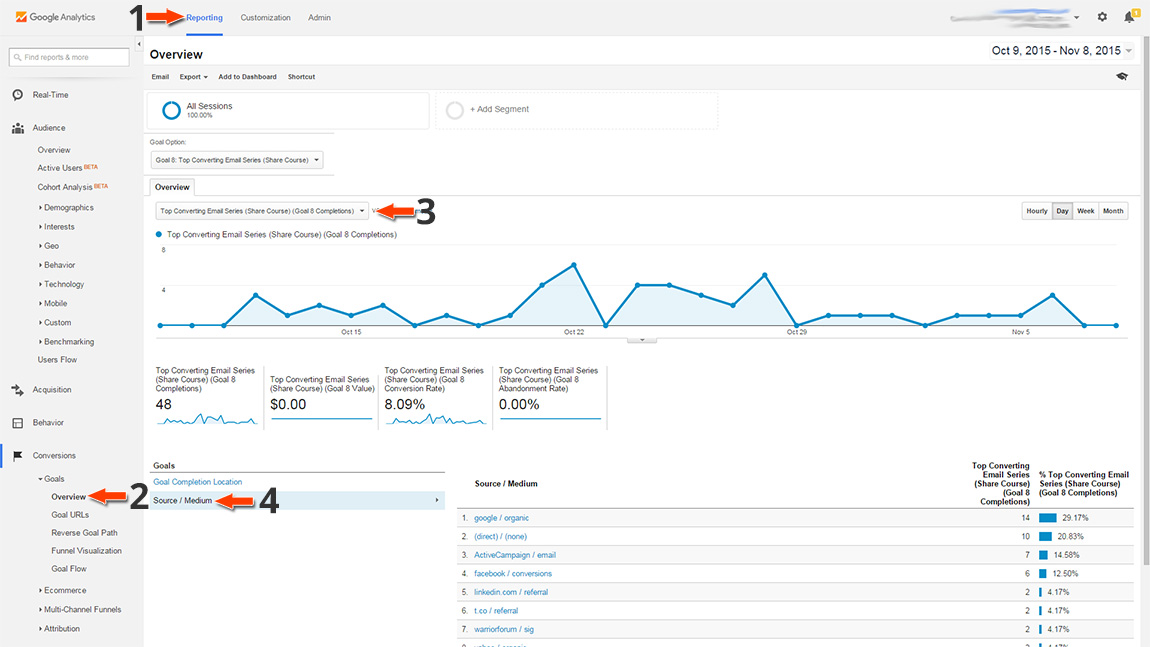
It looks like the greatest percent of my conversions for this goal are coming from Google!
The “Reverse Goal Path” is also a great report (it's the one I showed in the first picture of this post).
Conclusion
This is just the beginning.
The point of this post was to get you tracking your opt-in rates with Google Analytics and to show you a few basic views.
Now that you're tracking and recording data, you'll be able to analyze it in order to figure out what traffic converts the best, where it's coming from, etc. – so you'll know where to focus your efforts.
But, that's for later … let's take it one step at a time!
- Related Course: How To Optimize Your Sales Funnel